
There is a lot going in in the U.S. economy and financial markets. We boiled it down to four charts of interest to us today.
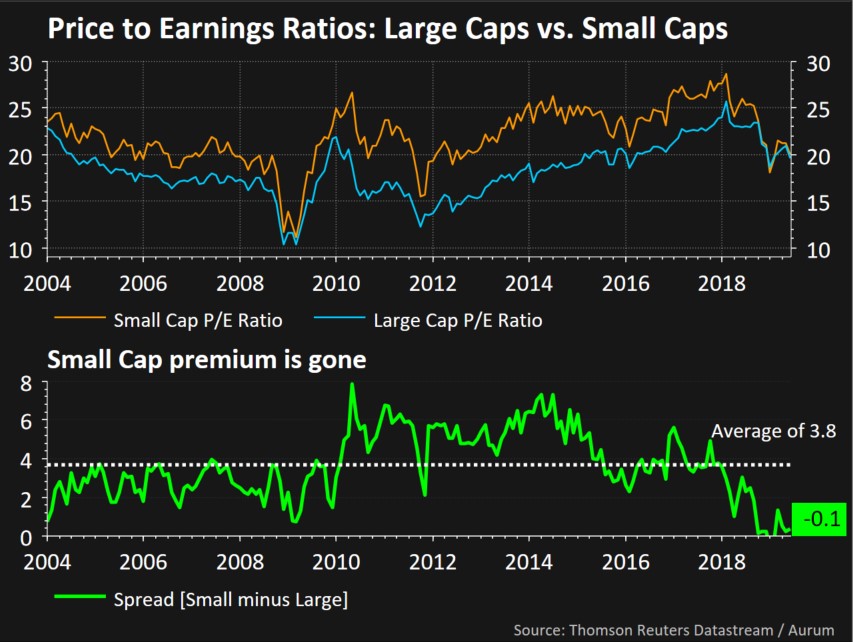
Over the last 15 years, small cap stocks traded at a premium to large caps. This has generally been the case throughout history, as smaller companies can grow earnings faster and thus deserve a premium price-to-earnings ratio. The exception was the tech bubble in the late 90s and early 2000s when the mania gave large caps a huge premium to small caps. The spread for the last 15 years has averaged about 4 points, but today its at zero. Investors do not have to pay a premium to own U.S. small caps for the first time in a long time. Small caps really traded richly from 2014 through most of 2018 and finally look more reasonably priced.
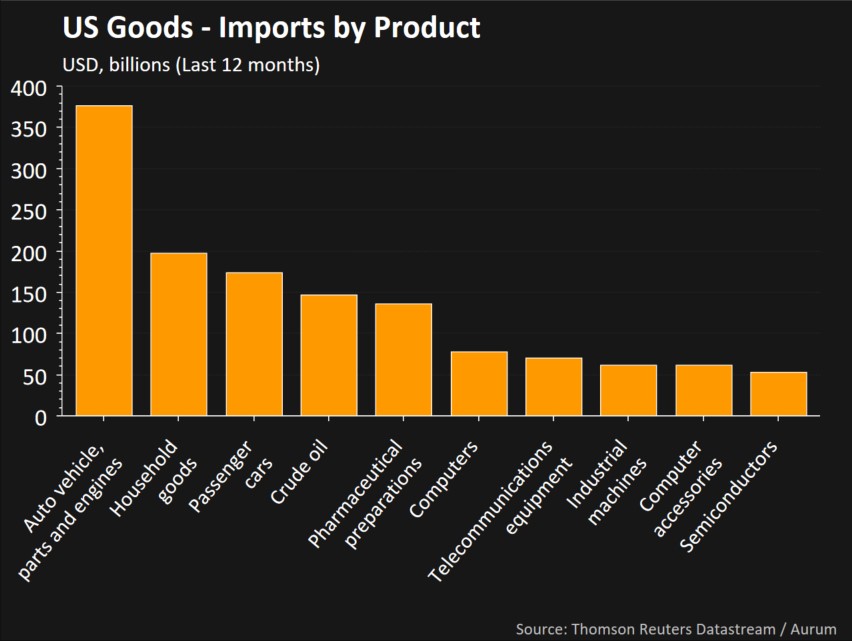
Here are the top ten import categories for goods into the U.S. Interestingly, automobile related categories make up two of the top ten and 40% of the total value of imports on this list at $550 billion. The list is relevant with the phrase ‘trade war’ sticking around for the last 16 months. It seems to be with us for a secular time frame as a core of this administration’s strategy.
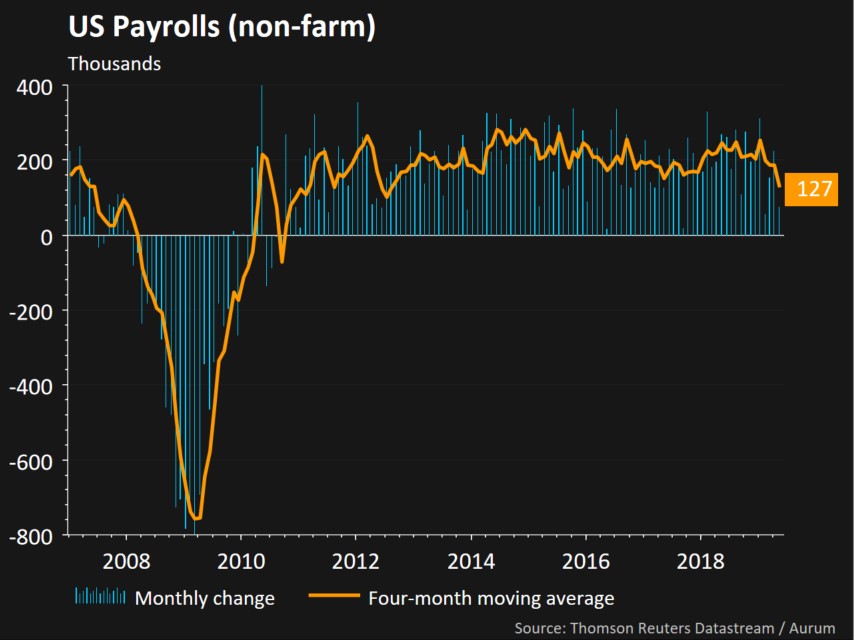
In two of the last four the four months, U.S. payrolls increased by less than 100,000. This is the lowest four-month moving average in job growth in seven years. The 100k to 150k level is a magic level because that’s what economists estimate the U.S. needs just to generate just to keep up with the growing demographic of job seekers. Is this a blip or a sign of a change in trend?
Below we have a seasonal chart of the ten-year treasury yield. It takes the previous years since 2011 and shows the highest level reached on a given day, along with the lowest and average. So far, the fall of the 10-year Treasury yield in 2019 was 70 basis points. The yield went from 2.78% to 2.08%, which hardly anyone expected. The speed and magnitude of the change in yield could mean that we have seen the bulk of the move year-to-date.
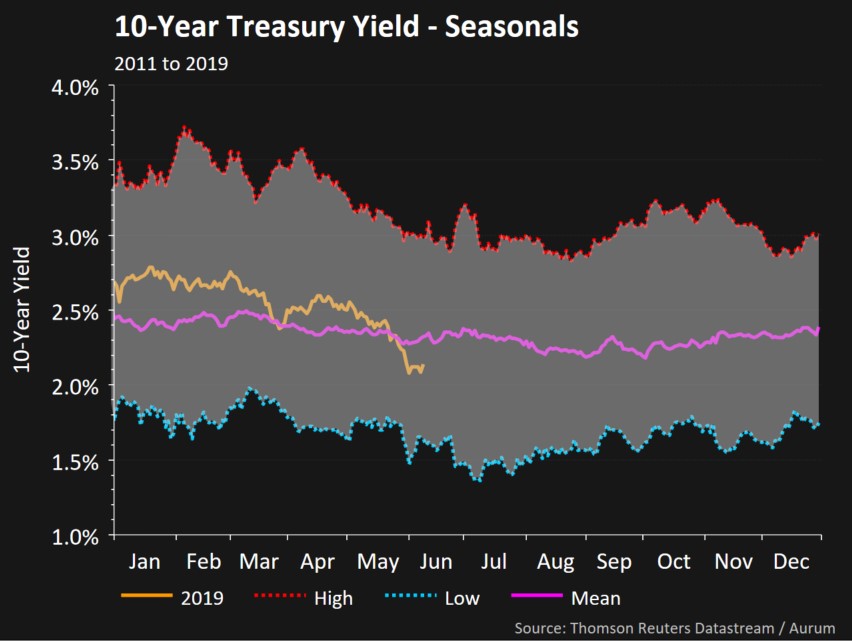
The other amazing thing about the above chart is how interest rates over the past 9 years have been in a range of roughly 1.5% to 3.5%. Despite the calls about ‘printing money’ and runaway inflation, these forecasts were simply wrong.
Important Disclosure Information
Please remember that past performance may not be indicative of future results. Different types of investments involve varying degrees of risk, and there can be no assurance that the future performance of any specific investment, investment strategy, or product (including the investments and/or investment strategies recommended or undertaken by Marcum Wealth, or any non-investment related content, made reference to directly or indirectly in this commentary will be profitable, equal any corresponding indicated historical performance level(s), be suitable for your portfolio or individual situation, or prove successful. Due to various factors, including changing market conditions and/or applicable laws, the content may no longer be reflective of current opinions or positions. Moreover, you should not assume that any discussion or information contained in this commentary serves as the receipt of, or as a substitute for, personalized investment advice from Marcum Wealth. Please remember to contact Marcum Wealth, in writing, if there are any changes in your personal/financial situation or investment objectives for the purpose of reviewing/evaluating/revising our previous recommendations and/or services, or if you would like to impose, add, or to modify any reasonable restrictions to our investment advisory services. Unless, and until, you notify us, in writing, to the contrary, we shall continue to provide services as we do currently. Marcum Wealth is neither a law Firm, nor a certified public accounting Firm, and no portion of the commentary content should be construed as legal or accounting advice. A copy of the Marcum Wealth’s current written disclosure Brochure discussing our advisory services and fees continues to remain available upon request. Please advise us if you have not been receiving account statements (at least quarterly) from the account custodian.
Historical performance results for investment indices, benchmarks, and/or categories have been provided for general informational/comparison purposes only, and generally do not reflect the deduction of transaction and/or custodial charges, the deduction of an investment management fee, nor the impact of taxes, the incurrence of which would have the effect of decreasing historical performance results. It should not be assumed that your Marcum Wealth account holdings correspond directly to any comparative indices or categories. Please Also Note: (1) performance results do not reflect the impact of taxes; (2) comparative benchmarks/indices may be more or less volatile than your Marcum Wealth accounts; and, (3) a description of each comparative benchmark/index is available upon request.